How long are we going to live?The answer to that question is constantly changing. According to the chart published by the CDC at the bottom of this page, the answer would depend on when you asked the question and how old you were at that time. 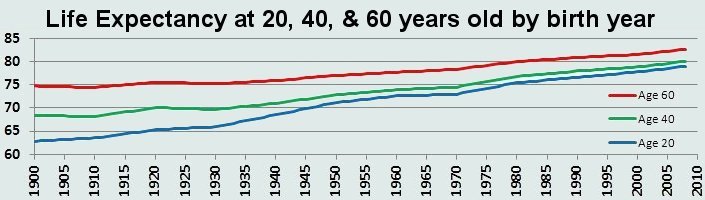 This graph illustrates two points. All of the lines are rising, so we are living longer and, as medical science continues to eliminate many of our fatal diseases, the lines are getting closer together. It would be an over estimate to base your Social Security life expectancy on the amount of time you are expected to live once you reach your retirement age. You would be ignoring all who were born on your birth year, worked for a period of time, made contributions to the system, and then passed away before receiving any benefit checks. The correct age is probably somewhere between 20 and 60, but it is going to take a large staff of actuaries and statisticians to come up with the exact age.
The CDC's " National Vital Statistics Report" which was published on September 24, 2012 includes the US Life Tables for 2008. The table insert to the right contains information taken directly from page 52 of that report, "Table 21. Life expectancy by age...". Based on your birth year, the numbers indicate how much longer the average American can expect to live once they reach a certain age. The column headings for each column indicate that the data was averaged over a 3 year period from the year before to the year after each decade. The table on the CDC website was created by the government so we modified the data to make it easier for non-bureaucrats to follow. We added the age at the beginning of each line to the remaining years of life in the body of the table so the numbers now represent the actual average age to which you are expected to live and we simplified the column headings to show a single year instead of the three year span around each decade. Here is the CDC's complete life expectancy table
Your life expectancy continues to increase with age because those who have died before that age are no longer part of that statistic. The ages also increase with each birth year. Next - How to fix the problem |
|||||||||||||||||||||||||||||||||||||||||||||||||||||||||||||||||||||||||||||||||||||||||||||||||||||||||||||||||||||||||||||||||||||||||||||||||||||||||||||||||||||||||||||||||||||||||||||||||||||||||||||||||||||||||||||||||||||||||||||||||||||||||||||||||||||||||||||||||||||||||||||||||||||||||||||||||||||||||||||||||||||||||||||||||||||||||||||||||||||||||||